 Tested Edge
The strategy graveyard.
Each method below was coded from written rules, run on years of real broker data with costs, compared against random entries, and checked on data it had never seen. Rules were fixed before any result was looked at.
ICT concepts
S&P 500 1-minute data, Jan 2014 – Nov 2026, 3,187 trading days. Displacement, FVGs, sweeps and opening-range breaks were about zero before costs and negative after. Full model on unseen data: 617 trades, 38% win rate, profit factor 0.69. Kill-zone setups did no better than random entries at the same times.
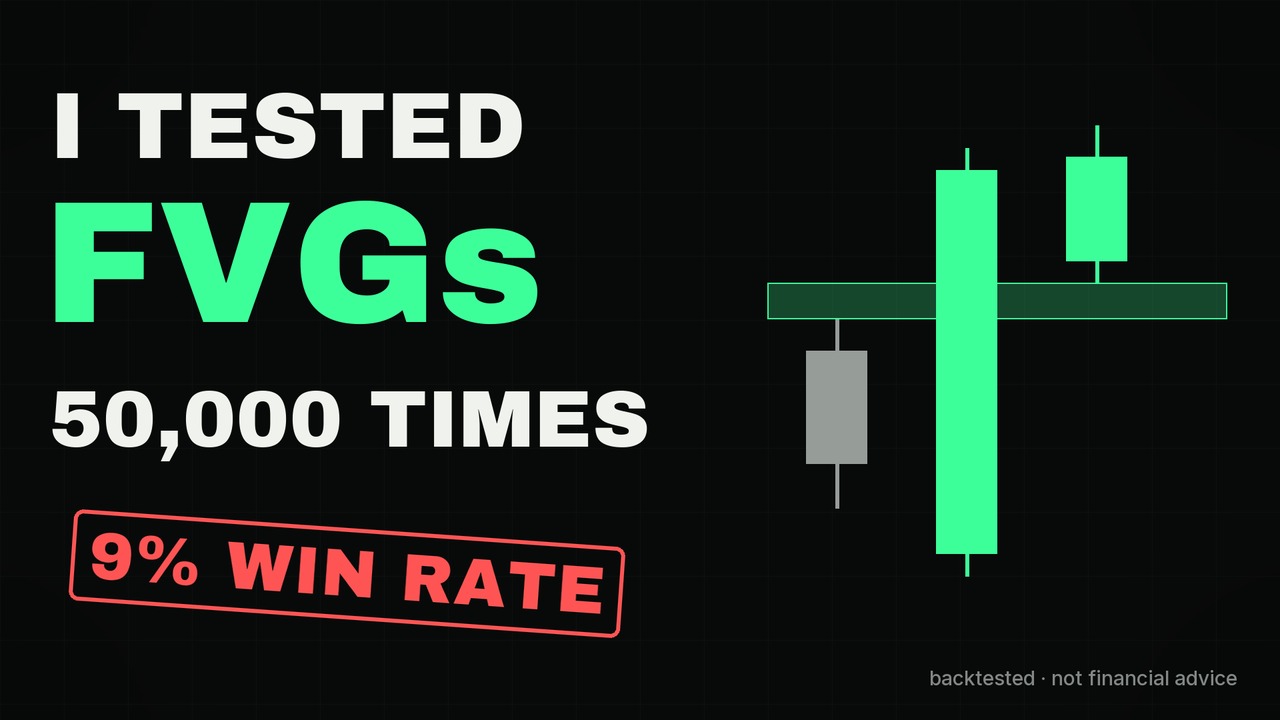
Fair value gaps
Blind bar-by-bar replay, about 50,000 trades on the S&P 500, NASDAQ, Dow and gold, 2014–26. 9% win rate; lost 0.18–0.28R per trade in every market and period. Daily FVG longs did no better than random on 10 unseen markets.
Quarterly Theory Judas swing
3,983 trades across 6 markets at the 07:30 New York true open. Profit factor 0.80.
TJR fair value gap and order block
89 trades across 4 markets. Profit factor 0.87.
265,000 intraday setups
14 setup types: breakouts, sweeps, break of structure, gaps and VWAP. 0 of 380 setup-and-context combinations survived costs.
NR7 breakouts
20 markets. Profit factor 0.70.
Machine-learning patterns
Walk-forward on 4 markets: 51.7% directional accuracy, which loses once costs are in.
Following COT positioning
17 markets, 2009–26. No out-of-sample predictive value; the positioning score's Sharpe ratio was −0.39.
A 1,536-rule computer search
Sharpe ratio 1.00 on the data it was built on, −0.16 on the data it hadn't seen.
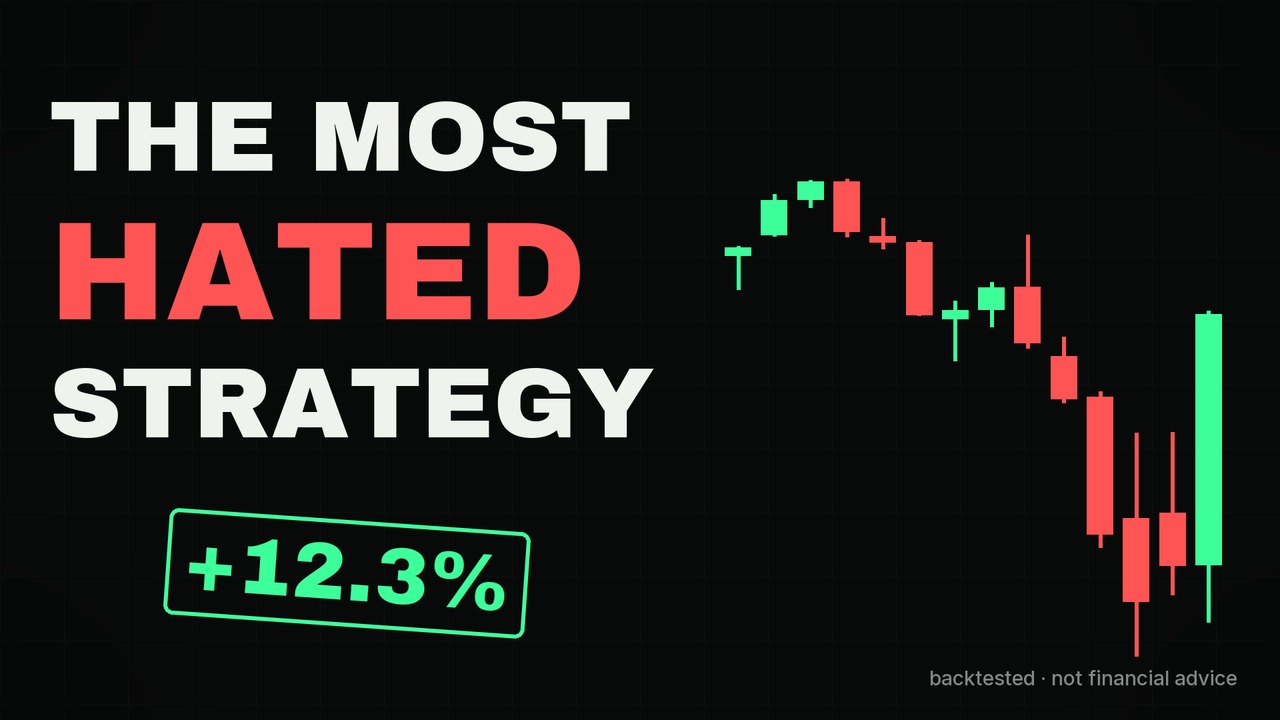
What survived: IBS dip-buying.
When a major stock index closes near the bottom of its daily range, it has tended to bounce. Across 7 indices from 2009 to 2026 (4,654 trades), that beat the market's own drift by about 10.9 basis points a trade (p = 0.004), and was positive in 83% of years.
Graded A to C, the A-grades won 72.6% of the time on 2023–26 data the model had never seen.
How we test
- Rules written before results fixed
- Real broker prices minute to daily
- Spreads and slippage included
- Random-entry baseline compared
- Unseen data held out
Watch the trials.
 I coded ICT and tested it on 13 years of data
 I tested the FVG strategy on 50,000 trades
 The most hated strategy survived my tests
 I tested the internet's favourite strategies
All results are backtests on historical broker data with modelled costs. They're research, not a promise of future results.